01. OVERVIEW
How I improved data gathering by 5x
I took my users daily data hunt from 20m to 4m, boosted their client satisfaction scores and centralized their entire 20+ spreadsheet system. Here is how I did it:
Strategy & Results
I tackled this project with a strategic, organized approach, prioritizing research at multiple stages, iterative feedback and a strong collaborative approach with developers, stakeholders and users in order to optimize my results. The result was a complex analytics dashboard that was simple, effective and looked beautiful for client presentations.
Key Metrics
Cut data hunt from 20m down to 4m
Centralized 20+ spreadsheets into one dashboard
Boosted client satisfaction scores
Increased time to insight by 5x
02. RESEARCH
Why is a dashboard needed, and what should it do?
My client had 20+ fragmented spreadsheets, which led to issues with inventory tracking, data gathering, client presentations & decisions making. They needed faster access to data.
Research Overview
Research took place at 4 points during this project. Before design began (pre-liminary research), with mid-fi prototypes, hi-fi prototypes and post launch testing.
For the Pre-liminary research, I dug into how sales reps actually scanned data: which metrics drove decisions, are where excel was failing them. I started from the ground, with no assumptions, validating hypothesized pain points through targeted discovery.
Discovery Methods
10 Sales Rep Interviews
20+ Spreadsheet Audits
Workflow heat mapping to identify scanning patterns
Dashboard Research
Step 1: Planning Phase
In order to understand how to build the dashboard, I began planning the pre-liminary research:
Project Background – Why are we doing this research? What design problems are we trying to solve? During this phase I also align the team and stakeholders on project understanding and research planning and goals.
Research Goals – What would we like the outcomes of the research to be?
Research Questions – What questions should this research answer? What should the focus and structure for this study be? Should we focus on qualitative or quantitative research?
Key Performance Indicators – What metrics will define the success of this research?
Methodology – How will this research be conducted for optimal results?
Participants – What characteristics should the participants in this study have? How will we create our representative sample and how will we ensure marginalized users are included?
Scripting – What should our research script look like for optimal results and to ensure there is no bias across interviews?

Step 2: Research Execution
Research execution followed different protocols for different discovery methods. For the user interviews I conducted, I focused on the following:
Building Rapport – It's super important to build rapport with participants, I achieve this by: being friendly, open and grateful, and using people-first language to make them feel valued.
Ask for Honest Feedback – I always ask for open and honest feedback to make sure that the participants don't feel like their critical feedback will be viewed as offensive and feel comfortable talking about their pain points.
Participant Understanding – It's important to understand the participants and their backgrounds to make sure I'm creating an environment where they feel safe and able to speak freely. I use this to optimize my language and mannerisms to build rapport during the study.
Open-Ended Questions – I find that open ended questions produce the most results and allow for more user feedback as participants are able to express more information about the product.
Follow Up Questions – I utilize follow up questions, such as "Tell me more about that" to gain further insight into what participants are thinking about the product and learn more about the specific issues we're discussing.
Think Aloud Method – I encourage participants to use the "Think Aloud Method" and externalize their internal thoughts and ideas so I can learn more about what they're thinking as they interact with the product.
Avoiding Bias – I always aim to avoid bias by being neutral but engaged, not reacting favourably to participant feedback, not asking leading questions and encouraging the participants to provide open, honest feedback.
Step 3: Synthesis & Analysis
Research synthesis and analysis started by writing the research findings and user quotes on sticky notes and organizing the data, finding key words and themes, and grouping them by patterns. I used affinity diagramming to cluster the data in order to make better observations. I took each insight from a cluster where there were multiple pieces of data from multiple participants to support the observation, and created a list of insights that were easy to understand and would increase user empathy.

Step 4: Presenting my Research
The fourth and final step of my research process consisted of taking those synthesized research findings and creating a presentation to present my insights and my recommendations for the project direction based on those insights. For this project I used PowerPoint to create a pitch deck for the project stakeholders (Execs and developers), demonstrating my research process, and how I arrived at those findings to ensure project alignment.
Preliminary Research Findings
1.
Excel Fatigue -> Clients disliked Excel exports
2.
Visual Overload -> Too many metrics reduced clarity
3.
Left to Right Scanning -> Larger charts & sales goals needed to appear first
4.
Inventory Alerts -> Restock alerts were needed, and had to be very visible
5.
No more than 3 core visuals -> More than 3 created cognitive strain
6.
Export button needs prime placement -> Should be in the top-right Fitt's zone.
03. PROCESS
A snapshot of my structured process
The Moscow Method
Based on the research insights, and stakeholder feedback, I created an Minimum Viable Product dashboard to validate assumptions and used the MoSCoW method to decide which core visuals to prioritize (sales goals/KPIs, inventory alerts) for the final interface.
Lo-fi Wireframes
Visual Design
For the dashboards visual design, I utilized preliminary research findings, insights from the user interviews on the lo-fi wireframes and the project direction I presented to my stakeholders to dictate the visual design of the dashboard. I implemented the visual design utilizing design principles and known UX, making strategic decisions in order to improve the readability of the data, ease eye-strain on the user and make development easier.

Mid-fi Prototypes
I started user interviews again at the Mid-fi stage to gain a better understanding of how my users were interacting with my prototype and further inform my design decisions as the project continued. At this stage I also performed a recall test (used in advertising research), to help determine the placement of the core KPIs. Through these research studies I also discovered the following:
Too many metrics visible causes visual paralysis
A search function should be implemented for quick access to client data
Inventory should be placed last

Hi-fi Prototypes
During the Hi-fi prototype stage, I used Framer Workshop to make my Figma prototype interactive, in order to simulate real usage for usability testing. I then performed usability testing on the Hi-fi prototype, capturing insights in moderated interviews, and organizing them in a spreadsheet by tasks, click path, quotes, observations and task completion. Using those findings, I discovered:
Alert notifications were overused -> I removed them on all but top priority items
Hover scaling decreased readability -> needed to be removed
Export button became too complicated with multiple export options -> I removed all options in favour of png exports (client preferred)
Dev Handoff
Once the final dashboard was approved, I delivered a complete dev handoff package, including: Figma prototype (150+ components, 28 screens, 10+ interactions), design system (Inter ss02 + colour palette), icon SVGSs and chart specs. In order to ensure proper implementation, I ran a workshop with the developers on the project to ensure they understood my designs and how everything worked so they could bring it to life.
Post-Launch Testing
Post-launch came the final testing for the project. I used moderated usability studies, and surveys to gain both qualitative and quantitative data in order to determine the success of the dashboard and outline and areas for improvement. Final research revealed the dashboard was performing optimally, and with only minor changes proposed from my key insights, my client was happy to keep the dashboard as is.

04. KEY DECISIONS
How my findings fueled key design decisions

Problem: 3 Core Visuals
Solution: Scannable Layout
I utilized my findings to create a layout that prioritized left to right scanning. High priority data is placed in prime fitt's areas and is revealed first to mirror natural scanning bheaviour and utilize progressive disclosure.

Problem: Visual Overload
Solution: Data Clarity
I utilized typography to create data clarity. Inter for it's superior financial legibility with alternate glyph sets to reduce disambiguation with 0 and O by using slashed zeros and open digits.

Problem: Excel Fatigue
Solution: UX Familiarity
I used Jakob's law to build recognition through known UX (Google Analytics & Quickbooks). I achieved this through Card-based KPI's in the prime Fitt's area, radial glowing rings that match analytics completion circles and hover tooltips.

Problem: Alerts & Data Visualization
Solution: Semantic Colour System
I leveraged semantic universals: sequential blues (darkest=highest revenue) follow perceptual lightness scales for trend scanning while diverging colours (red/yellow/green) visualize postive and negative changes in the datapoints.

Problem: Eye Fatigue
Solution: Dark UI
A dark UI reduces eye strain with 40% less blue light emission (Harvard UX research). I chose a dark navy to decrease the harshness of a black UI and mirror high end finance tools.

Problem: Dev Handoff
Solution: Dev-Friendly Iconography
For the project icons I selected Google Material Icons. This allows for Figma native drag and drop support, dev ready SVGs with perfect pixel alignment and icon weights that match Inter's 500-weight rhythm.
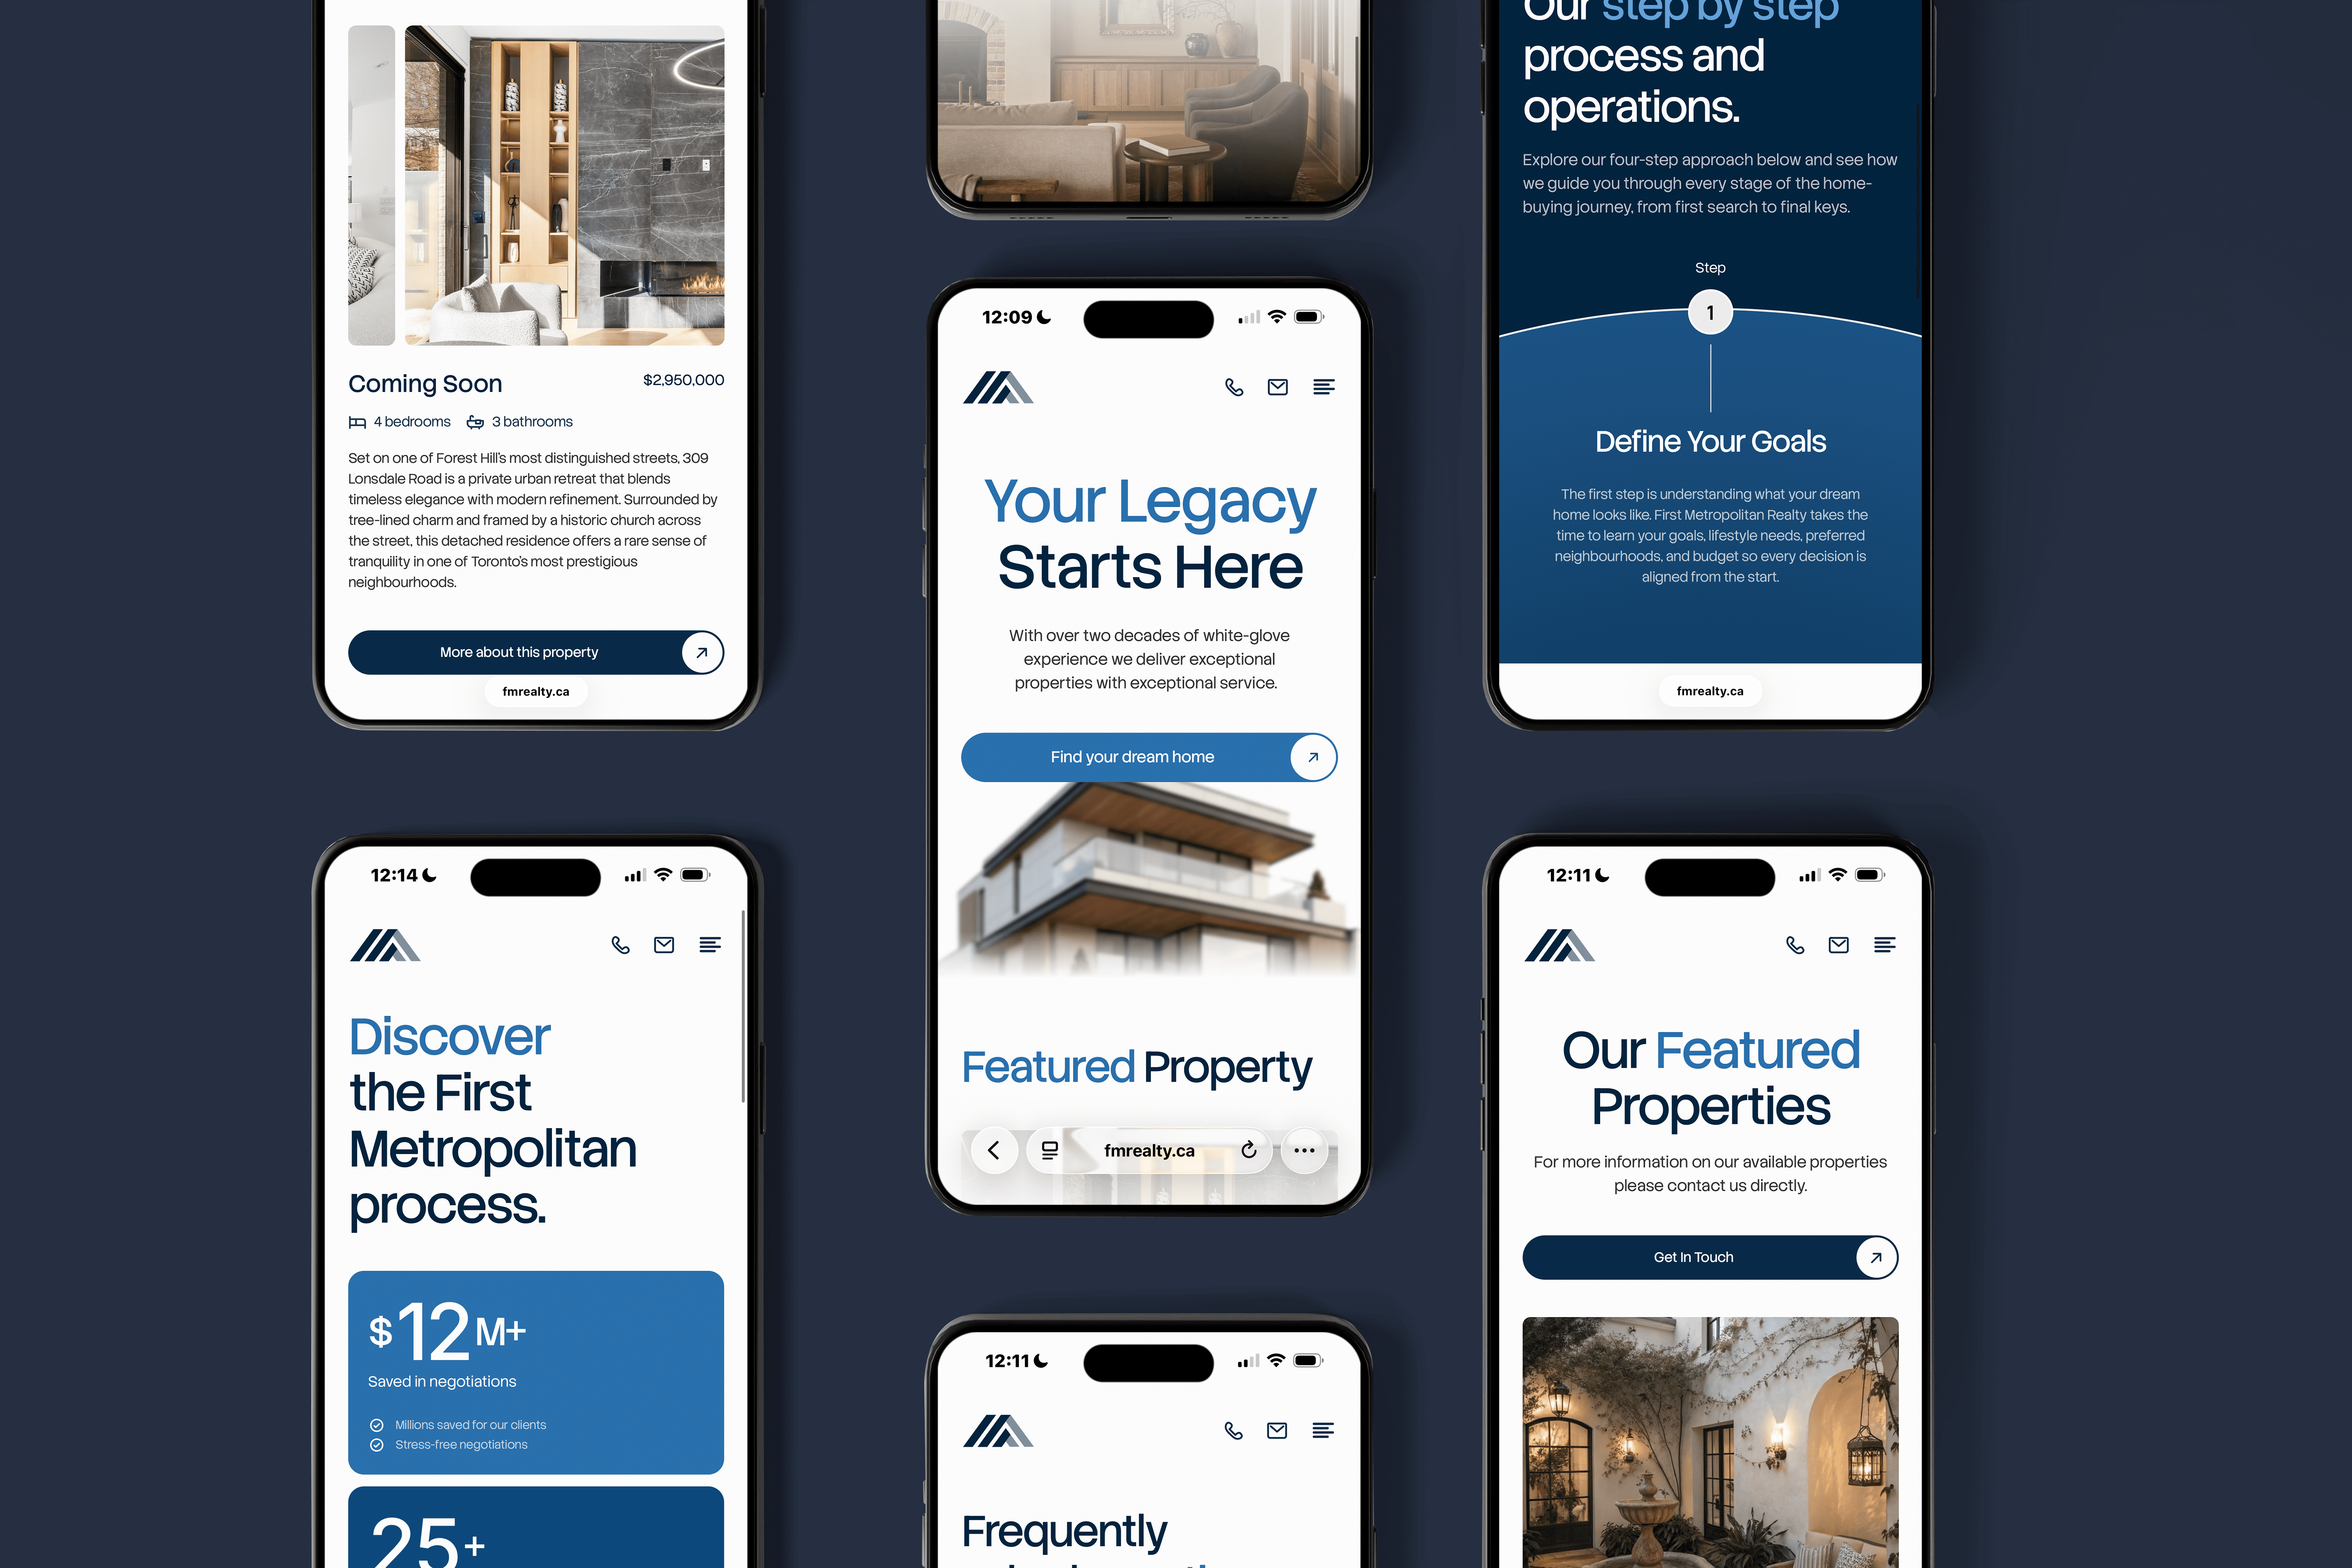
Interested in learning more?
Check out my case study on the conversion optimizing website I designed for a real estate brokerage here:
5min Read